Lot Testing - What is statistically significant

TimeOutside

Andrew
Minuteman
Apr 25, 2024
7
9
Hollister, MO
When looking for an answer to a completely different topic, my search returned a few posts regarding lot testing. There were comments and questions such as how many shots should be taken and will just 5 or 10 shots give any meaningful information. So I pulled out one of my old tools to see for myself.

Before I retired, I spent many years where my job required me to use statistics to validate both performance of systems and to validate that improvements made to a system were meaningful (significant). The (Excel) tools I created to perform these tasks were validated by statisticians who were university professors. Although I am fairly versed in statistical analysis, I am not a statistician myself. So, if there are any statisticians around that will validate my conclusions related to their use in lot testing, that would be great. Anyway...

The image I've attached is a screenshot of my analysis workbook where I've made comparisons between lots. The first five are actual test shots provided by Anschutz North America. The other five, I provided as additional examples. I purchased one of the lots (Lot 010). At the time, I purchased it because it had the smallest group of the fourteen lots they tested. But the question I wanted answered now is, are five shot groups adequate for demonstrating that one group is conclusively (statistically) better than another? Yes, Lot 010 is conclusively better than the other lots - even though only five shots were taken for comparison. That said, it is most certainly better if more shots are taken. I don't want to imply otherwise. The margin of error will be smaller as the number of shots taken are increased, so (for numerous reasons) the more shots the better. But groups of as low as five shots can be statistically meaningful.

If someone would like a copy of the Excel workbook used, I will be happy to provide it.

So, please take a gander and let me know what you think.
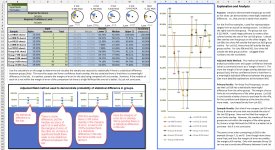
Lot Testing Analysis.jpg
 
When I lot tested my CZ Bench rifle I just looked at what shot best. Here is how I did my lot testing
I got 9 lots of Eley Match. I choose the lots based on there being at least 200 more boxes available.
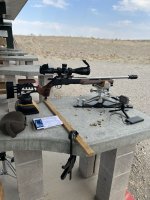
My plan was to shoot 5 5 shot groups with each lot. I found that 5 lots were not good and I could see this after just 3 5 shot groups. The reaming 4 lots shot much better with 2 lots really standing out. I then shot 5 more 5 shot groups with the two best lots and one lot was the clear winner. I then ordered a case of the best lot for KSS sports and I had in 3 days. I can tell you the case I ordered does also shoot very well in two other CZ's I have. Here is a pick of my bench CZ.

IMG_0636.jpg
 
I'm not a stats guy, but have cursory knowledge of it. Differentiating sets from population can be confusing, at least for me. Given the wide variability in 5 shot group sizes, I would not draw any conclusions based off a single 5-shot group. I'd like to see 5-10 groups of 5, so we can get a 25 or 50 shot population.

When I lot tested my CZ Bench rifle I just looked at what shot best. Here is how I did my lot testing
I got 9 lots of Eley Match. I choose the lots based on there being at least 200 more boxes available.
My plan was to shoot 5 5 shot groups with each lot. I found that 5 lots were not good and I could see this after just 3 5 shot groups. The reaming 4 lots shot much better with 2 lots really standing out. I then shot 5 more 5 shot groups with the two best lots and one lot was the clear winner. I then ordered a case of the best lot for KSS sports and I had in 3 days. I can tell you the case I ordered does also shoot very well in two other CZ's I have. Here is a pick of my bench CZ.

View attachment 8504744
That is basically how I do it. You can sometimes see inconsistency fairly quickly, but consistency only appears after several groups.
 
  • Like
Reactions: TimeOutside
First off, the subject needs more specification. "How many shots?" depends on the level of resolution you want to determine "better" with confidence.

That being said, In order to create a repeatable test, expect to shoot 35-50 rounds of each variable change to reliably quantify performance based on a single test. This is around the order of magnitude that most practical precision shooters would want to see probably in the .0X" range for mean radius.

The variability of repeat tests in 3, 5, 10, 15, and even 20-shot strings is enough that considerable overlap can exist on single tests of each variable. 20 shots is sort of the bare minimum that I even look at anymore if I am attempting to quantify dispersion performance. The "confidence density" if you can think of it that way, is best doing large sample single tests, or composite small tests WITH A COMMON POA REFERENCE. If you lose the POA reference and only look at mean radius of four 5-shot strings, for example, you have less data than a single 20 shot test. If you correlate/overlay the common POA, you have the same data with a single 20 or 4x 5-shots. Hopefully that makes sense.

You will also see, when you dig into this subject that the viability of group size vs. mean radius is basically a moot point up to 15-18 shots. The variability as a percent of the long-term average is in the same realm (huge on both). Once you get to 18-20+ shots, mean radius is significantly a better predictor of the population from which the sample comes, and the more rounds you pile in, the more accurate mean radius is as a predictor vs. group size.

Unfortunately, the reality of this is that to get truly definitive values down to the .001" requires samples in the realm of 200 shots. In other words it's VERY common to get "lied to" if the results are remotely close to one another until/unless you plug what most people would consider an unreasonable amount of ammo into the tests.

Functionally, if you shoot a 20-shot string of 2 different lots/loads and one is a mean radius of .25 and one is a mean radius of .28, flip a coin. Long term they could go either way. However, if one is .25 and one is .40, odds are the .25 is going to be better.

Also, on the point of the coin flip situation, it really doesn't pencil out to much for hit probability and it's probably not worth worrying about. This is where I'm coming from when I've posted about this subject before, or even on the Hornady Podcast where I've said you won't likely see the difference between two similar loads even if one is technically better. At some point the best bang-for-the-buck option is to allow "good enough" to be good enough, and have an educated perspective on what that is.

Conclusion: Best bang for the buck if you really care about statistically significant data, 20-35 shots per variable change. Use mean radius. Understand there is still variability in those tests and set your expectations accordingly.
 
I should say, also, that groups will obviously never get smaller. If you shoot 3 shots and you have a 3" group.... It's going to take a very unique circumstance for that to be a viable option and you can probably write it off. It's not reliable to get the worst 3 shots of a population in the random 3 shots you shoot, but it can happen and can be used. Just bear in mind that if the 3 shot group is .75 MOA that might not be horrible, and the next 3 shot group could be .2 MOA. However, if the first 3-shot group is 1.5 MOA, odds are it's not a great fit for your barrel. YMMV.
 
When I lot tested my CZ Bench rifle I just looked at what shot best. Here is how I did my lot testing
I got 9 lots of Eley Match. I choose the lots based on there being at least 200 more boxes available.
My plan was to shoot 5 5 shot groups with each lot. I found that 5 lots were not good and I could see this after just 3 5 shot groups. The reaming 4 lots shot much better with 2 lots really standing out. I then shot 5 more 5 shot groups with the two best lots and one lot was the clear winner. I then ordered a case of the best lot for KSS sports and I had in 3 days. I can tell you the case I ordered does also shoot very well in two other CZ's I have. Here is a pick of my bench CZ.

View attachment 8504744
Gixxer that Woox chassis sure is pretty. question, that wide flat benchrest forend is it a Woox , don't see it on their website ?
 
  • Like
Reactions: 68hoyt
I've been to Lapua in Ohio several times both testing new rifles and retesting older rifles that have run out of the tested ammo. They use 10-shot groups to find out what looks "interesting" and then shoot another 10-shot group to either verify the best one or further lower the pool of candidates. Seems to work.
 
I still wonder what does the factory consider to be statistically significant ? :unsure:

Supposedly every batch of match quality cartridges are rated according to results
produced from the samples fired in the test tunnels at the factories.
What number of cartridges are needed to test to provide a reliable indication of batch quality?

What is the level of confidence used? 75%? 80%? 90%? 95%?
What error is acceptable in the calculation? 10%? 5%? 1%?
What is the acceptable defect rate per 100,000 units?
Considering the latest deliveries from Eley have produced some unsatisfactory batches,
is the factory batch testing less than reliable?

Here's a link to a sample size calculator:


Input some numbers and compare the sample sizes required
with the different levels of confidence desired.
 
Last edited:
I’ve been thinking about why statistics seem to show why small numbers of groups are significant but I do t find them so.
I’m now wondering if it is related to shooting inside vs outside. I do my testing at 100 yards.
It takes me several range trips to select the best ammo even under seemingly great conditions.
Otherwise I get what @justin amateur calls “random acts of accuracy” that skew towards one lot over another.
 
  • Like
Reactions: TimeOutside
When looking for an answer to a completely different topic, my search returned a few posts regarding lot testing. There were comments and questions such as how many shots should be taken and will just 5 or 10 shots give any meaningful information. So I pulled out one of my old tools to see for myself.

Before I retired, I spent many years where my job required me to use statistics to validate both performance of systems and to validate that improvements made to a system were meaningful (significant). The (Excel) tools I created to perform these tasks were validated by statisticians who were university professors. Although I am fairly versed in statistical analysis, I am not a statistician myself. So, if there are any statisticians around that will validate my conclusions related to their use in lot testing, that would be great. Anyway...

The image I've attached is a screenshot of my analysis workbook where I've made comparisons between lots. The first five are actual test shots provided by Anschutz North America. The other five, I provided as additional examples. I purchased one of the lots (Lot 010). At the time, I purchased it because it had the smallest group of the fourteen lots they tested. But the question I wanted answered now is, are five shot groups adequate for demonstrating that one group is conclusively (statistically) better than another? Yes, Lot 010 is conclusively better than the other lots - even though only five shots were taken for comparison. That said, it is most certainly better if more shots are taken. I don't want to imply otherwise. The margin of error will be smaller as the number of shots taken are increased, so (for numerous reasons) the more shots the better. But groups of as low as five shots can be statistically meaningful.

If someone would like a copy of the Excel workbook used, I will be happy to provide it.

So, please take a gander and let me know what you think.

View attachment 8503917

Nice work (y)
 
1726930588995.png


Always wondered what the best way for expressing outcomes would be.

Group size would be easiest, but then - there’s probably also something to be said about the radius from the target.

I long lost the math skills to express a unified measure as an expression of both.
 
Last edited:
  • Like
Reactions: TimeOutside
I still wonder what does the factory consider to be statistically significant ? :unsure:

Supposedly every batch of match quality cartridges are rated according to results
produced from the samples fired in the test tunnels at the factories.
Perhaps it's worth considering that the factory doesn't test all of the ammo it produces. After all, no variety of match ammo comes with a performance guarantee of any kind. Some lots are not very good and shoot rather poorly. Why test at all?

It's worth noting that after many complaints from buyers, it seems Eley issued a rare recall of some of it's Ultra Long Range ammo. A recall wouldn't be necessary if the lot in question had been factory tested. The message shown below was reproduced and posted in a thread here in post #32 https://www.rimfirecentral.com/threads/eley-ultra-long-range.1304633/

 
  • Like
Reactions: TimeOutside
So, please take a gander and let me know what you think.
I'll respond to your request. I don't at all believe that your method has any practical application in lot selection. My opinion is based primarily on experience rather than knowledge of statistics. I gave your presentation enough of a look to form an opinion as to the weakness in the method. That is that a completely different conclusion would be made if the same process was run on a second set of five shot groups which we all know could look quite different one from the other.

I could be wrong but since you asked ...
 
  • Like
Reactions: TimeOutside
@JB.IC is a stat guy, I believe.
@Ledzep did a good job of explaining it. I would say small sample sizes are fine if you can deal with the uncertainty around the estimation. I briefly looked over the OP’s image. The confidence level was 65% and it being that low would make any uncertainty quantification look good. Since group sizes are a joint dispersion density, it’s akin to being a variance statistic. Normally, 90% confidence is used for variance. Variance distributions are highly skewed at low sample sizes, so we normally settle on 90% CI otherwise a higher level would cause the width of the interval would be massive at low sample sizes. To reduce the skew of the distribution, you need a sample size of around 20. Which matches nicely with @Ledzep suggestion. The distribution shrinks and uncertainty reduced at larger sizes.

That being said, I don’t spend much time analyzing or testing group sizes. I am thinking about building a BR rifle to get more into it, but my field rifles are not repeatable enough for me to put much confidence in any analysis of my own.
 
  • Like
Reactions: Ledzep and Williwaw
Sorry folks. I took a mini-vacation with my wife, so no pursuing this matter again until now.

I can't say that I disagree with anything said, especially the comments from @Ledzep and @JB.IC. Still, there is my initial question. Are five shot groups adequate for demonstrating that one group is conclusively (statistically) better than another? Then perhaps more importantly, is i meaningful and useful for assisting in selecting a particular lot of ammo to purchase. I'm tending to still think yes, as long as you understand the meaning and limitations.

And let me say, I'm tossing all this out here as much to increase my understanding as anything else. My knowledge of statistics is limited to sampling in transportation and manufacturing. In transportation, sample sizes were usually in the thousands (sometimes tens of thousands) with generally accepted confidence levels between 80 and 90 percent. In manufacturing, the sample sizes were in the hundreds with generally accepted confidence levels between 95 and 99 percent. Both were binomial in nature. That is, either the vehicle was detected properly or it wasn't, or the equipment worked perfectly or it didn't. This is in contrast to sampling of populations, such as determining the mean weight of American males. Applying my limited knowledge to really small sample sizes may be yielding totally wrong answers. I can accept that. Just help me understand.

Anyway, here's my (current) thinking:

Some obvious limitations that can significantly limit the validity of any test - most especially tests with very small sample sizes:
  • The environment. For example, a variable wind will certainly have an impact.
  • The equipment. For example, sock bags on a picnic table versus high quality benchrest equipment on concrete.
  • The shooter. For example, me versus virtually anyone at all with benchrest equipment.
  • The ammo. For example, Remington Golden Bullets versus RWS R50. Even if somewhat consistent, the higher percentage of fliers in Golden Bullets make small sample size lot testing worthless.
  • The rifle. For example, a Marlin 795 versus a Voodoo.
My understanding (correct me if I am wrong) is the more that confidence intervals overlap between groups then the less certainty there is that there is a difference between the groups. Ideally, to demonstrate a clear difference between groups (ammo lots in this case), there should be no overlap in the confidence intervals. Since as the confidence level increases the confidence interval widens, in order to get separation between two group's CIs then one must either increase the sampling size or decrease the confidence level. Am I right so far?

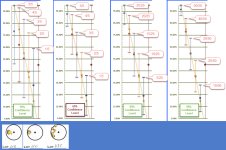
Looking at the new screenshot showing the graphs with several different confidence levels and sample sizes, one can see with a 95% confidence level and small (5 shot) sample sizes that the confidence intervals overlap so much that the testing is essentially meaningless. Increasing the sample sizes to 25 shots shrinks the confidence intervals enough that differences emerge. Increasing to 50 shots becomes more conclusive.

But what about 5 shots at a 65% confidence level? Well, were looking at 17.5% being higher (better) than the upper bounds of the confidence interval. I'm thinking we really don't care if the shots are better performing than expected. That leaves us with 17.5% of the shots being worse than the lower bounds of the confidence interval. So, if we made 100 of the 5 shot groups, about 18 of them would be worse than expected. I'm thinking being correct or better 82% of the time is meaningful and useful - even with the small sample size and knowing the limitations. Am I correct in this conclusion?

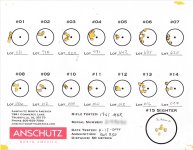
The three groups shown at the bottom in the screenshot were taken by an expert marksman, in a controlled environment, with RWS R50 ammo, using professional equipment, and a capable rifle (an Anschutz 1761). I'm thinking even with a small, 5 shot, sample size that Lot 635 (and other lots with similar groups) can be quickly dismissed with a high liklihood of not being good in that particular rifle. Lot 010 is likely better than Lot 013, however more shots would be required to make a conclusive determination. Right? Given that I didn't have the opportunity to do more tests between Lot 010 and 013, I chose Lot 010. I'm thinking the fourteen 5-shot groups that were provided to me by Anchutz North America let me select a lot number that has a significantly higher liklihood of performing well in my rifle than had I just let them randomly pick a lot number and send it to me. Am I correct in this thinking? If so, I'm standing on the statement that 5 shot groups are indeed meaningful and useful, both statistically and practically.

And sincere thanks for helping me dig into this matter.

Changes with different confidence levels.jpg
 
  • Like
Reactions: Ledzep and Edsel
Note: This is off of memory/experience and I'm drawing this in MS Paint so bear with me. I think I can convey at least the concepts without having to drive into work to bust open MatLab.

An individual shot group, if you break up the X and Y coordinates of each shot will have pretty "normal" distributions of the X's alone and the Y's alone about the mean point of impact (MPOI). Small data sets the histogram looks messy, but when you pile in 100 or 500 rounds into a single group (we've done this) you get really normal data sets.

From everything I've seen, when the system (rifle+ammo+optic+etc.) is doing what it's supposed to be doing, isn't overheated, isn't broken or otherwise maligned, the distribution of shots is random. You can do this in cartesian coordinates with normal random X and then normal random Y (using the same SD for each axis, ideally), and the total group size or the mean radius will be constrained by the variance or SD. If you look at it radially, the Raleigh distribution seems to track very close to reality, and how tight/loose that distribution is, is controlled by a scalar factor in the distribution. An important thing to keep in mind here is that even though the X's and Y's in cartesian are normally distributed, each X is also tied to a distinct Y. So the X bell curve is centered on the MPOI, and they Y bell curve is centered on the MPOI, and those represent the probability of a particular shot landing up/down and left/right, but each X is tied to a given Y, and it's very unlikely for an exactly or near-exactly centered X to also fall on a near-exactly centered Y, which is why you see in the radial Raleigh distribution the probability go basically to zero of a perfectly centered 0,0 shot. This tracks with empirical data.

Distro.jpg


This is all kind of a preface to say that your rifle is (within the rules of the distribution) randomly distributing shots. It's not an ultra-accurate laser beam with a wandering POI, it has no memory of the last shot, the last group, etc. Obviously different ammo types/powder types/projectile materials/lube/cleaning solutions, etc... can all cause fouling differences but typically (well) within 5-10 rounds those are normalized. I'm sure there are exceptions to this, but I'm referring to properly built and maintained systems that are assembled correctly and fouled in.

Your rifle + ammo combination produces a given population metric (X/Y SD, Raleigh Scalar, Mean radius, Group size...). That is to say that if you used the entire "useful life" of the barrel firing "Ammo A" into a single group, you could then know exactly what that metric was. Then if you had a time machine you could go back in time with the same barrel in a "new" state again, and do it with "Ammo B", "Ammo C", etc. and each would produce distinct results. Those results are ultimately what you want to know when you test Eley vs. SK vs. Lapua, lot vs. lot, or barrel vs. barrel. Obviously, you don't have infinite funds, the test fixtures, nor a time machine. So we test smaller samples. Key point to keep in mind, however: Your rifle + ammo combination does have a distinct population dispersion metric.

So, more directly to your question... If you shoot a bunch of 5-shot groups the results of those groups (group size or mean radius) will produce a whole new normal distribution. They will produce an average group size and have a variance in each direction. A bell curve. There is some skew to this going from really tight to really bad dispersion. However, that variation is almost always such that if all you have is a single 5-shot group, you basically know nothing. :ROFLMAO: :cry: The overlap between a population that will produce .35 MOA mean radius (kinda "meh") and .18 MOA (pretty nice) mean radius is most of the bell curves of what 5-shot groups will produce. The separation you need between two 5-shot groups to say that one is better than the other has to be huge. Like if group A is .15" and group B is 1.2" you might be safe. 10 shots tells an immensely better story, and 20 shots starts getting into the realm that you can draw some limited conclusions based off of a single test of each population because the more shots you shoot into the group, the tighter the legs on that bell curve get. Remember the time machine example I gave above? Imagine the thousands-of-shot group that would result from that with "Ammo A". Assign each shot a number then completely randomly draw 5 shots from that group. What are the odds that those 5 shots accurately describe that group in either size, distribution, or location? (spoiler alert: Very low)

From the 3 groups in your last post, I'd say that from an experience-based standpoint, Lot 635 has a pretty good chance of not "winning", but if all that you have is those 3 groups... I'd shoot more, personally. Between 010 and 013 it could go either way in the long run. In fact, I've seen a TON of tests in our accuracy lab where the first 5 shots pound into knots then fall completely apart after that. You're at the mercy of random distribution. If those were 10 shot groups of roughly the same spread, I'd feel a lot more confident about dropping 635, and I'd still say it could go either way between 010 or 013.
 
Your rifle + ammo combination does have a distinct population dispersion metric.
A further issue, the population parameters are conditional. Every time something changes be it bore conditions, shooting environment, shooting surface, etc., the parameter changes with it.
 
  • Like
Reactions: Ledzep
A further issue, the population parameters are conditional. Every time something changes be it bore conditions, shooting environment, shooting surface, etc., the parameter changes with it.
For sure, good point. I like to make the assumption that there's a stable useful barrel life but in reality the condition of the barrel is changing every shot. Also, internal ballistics change with temperature, throat erosion, etc.

Then there's always the shooter and the crazy shit going on between his ears... :)
 
  • Like
Reactions: JB.IC
From the 3 groups in your last post, I'd say that from an experience-based standpoint, Lot 635 has a pretty good chance of not "winning", but if all that you have is those 3 groups... I'd shoot more, personally. Between 010 and 013 it could go either way in the long run. In fact, I've seen a TON of tests in our accuracy lab where the first 5 shots pound into knots then fall completely apart after that. You're at the mercy of random distribution. If those were 10 shot groups of roughly the same spread, I'd feel a lot more confident about dropping 635, and I'd still say it could go either way between 010 or 013.
Thank you very much for your time and effort in explaining the matter. I'm with you for most of it. It fits with my understanding of distribution, although much more clearly explained than I've ever seen before. One question I have is regarding building the normal distribution (bell curve). Is it the normal distribution for the rifle, the lot being tested, or both. I'm thinking both. If it is only the lot being tested, then indeed 5 shots tells us absolutely nothing. One has no ability to tell whether the 5 shots are nearer the upper CI, the lower CI, or even outside the CI range. However if it is both then shooting a number of 5-shot groups, even from different lots, starts populating the normal distribution for the rifle and ammo being tested. In my case, I could build a fairly decent curve with 70 shots (14 lots tested with 5 shots each). While I'm not building a curve for the individual lots, I am building a curve for that rifle and the ammo being tested. Even better, in my case, I'm comparing lots of RWS R50, not a mix of RWS, Lapua, SK, Wolf, and Eley. With 70 shots, I'm thinking one can start weeding out the outlier groups (lots). Certainly, with only 5 shots being made per lot, it is quite possible (probable) that some will not be representative of the normal distribution for that lot if more shots were taken. One might eliminate what could have been a keeper lot if only more shots had been taken. One might keep a lot that would have been eliminated if only more hots had been taken. But it seems to me this would still be a meaningful start. Once a few winning lots are selected then one could purchase one to four boxes of the winners and do more meaningful testing. Is this line of thinking correct?

1761 Test Shots -.jpg
 
Yeah I think you're on the right track.

The distribution being created... more like revealing itself to you, is of the combination of all things put together that yield that level of performance. Most basically I tend to think of it as the barrel+ammo, but there is nuance as JB.IC pointed out. Any time you change a (contributing) variable, you're technically dealing with a different population. Bedding, stocks/chassis, scopes, rings, could all play into that performance.

In the centerfire world I look at almost the exact same subject in "load development", where I can try different bullets, powders, primers, seating depth, etc... It's very similar to the testing you're doing. In centerfire load development, I taste test many different bullets or powders with 10-shot strings and if things look promising I will devote more ammo to the ones that show promise, just like you mentioned.
 
  • Like
Reactions: JB.IC
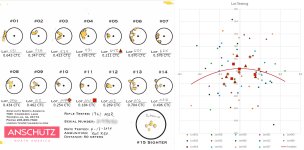
I created the distribution chart shown below yesterday morning before church. I've been pondering it off and on since then. It shows the 70 shots taken. The three best groups (center-to-center) have specially shaped symbols on the chart. (Lot 010, the best. Lot 008, the second best. Lot 642, the third best.)

We know that all the 5-shot groups are in question as to whether they accurately represent their lot. We know our confidence would go up if we had 10, 20, or more shots per lot. But we don't have those shots.

I still hesitate to say that 5-shot groups in a lot test are totally worthless. But we wouldn't know that unless we took each of those lots and finished out the box, plus did it for a goodly number of other boxes. Then we could calculate the confidence that a 5-shot group was representative of the entire lot. I suspect that someone has that data. It would be good information to have.

I'm also hesitant to say that 5-shot groups in a lot test are totally worthless when more than a handful of lots were tested. (In my case, fourteen.)

So, given what data we have, it seems that any one of the top three lots in the testing would be the best for purchase - or better yet, if possible, further testing of the lot. Even though we know that any one of those lots could be a "random act of accuracy", we have to start somewhere.

I wish we knew the overall confidence on how much a single 5-shot group was representative of the whole lot. Then, I think, we could put some numbers to the confidence of lot selection using 5-shot groups.

Thoughts.

1761 Test Shots -.jpg
 
  • Like
Reactions: RTH1800
My guess, 5 shot group out of a lot that lets say is 5 cases(25,000) is .0002%! Even a whole box of 50 in that same situation is only .002%. So you you figure it out. Not much hope unless a whole bunch of shots are fired, but that's way too costly. No knowing exactly how many are in each lot is something I will never know.

So I test 50 (10 5 shot groups) over the chrono and make my best guess which lot is better. Use group sizes, ES and SD. Best I know how to do. Maybe I should do 25 2 shot groups as some suggest.
 
This is my non scientific method.
I fire a 5 shot group with each lot to be tested.
The bad ones are eliminated.
Middle of road and better are re tested with 3 10 shot groups.
If one stands out I use it. If two are close I re test 3 more 10 shot groups and make a decision.

It works well enough for my purpose.