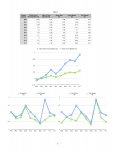
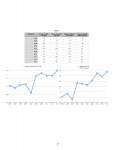
Here is some data in chart form that I collected today. Details:
MPA rifle, Curtis Axiom WTO Switchlug, 26 in Spencer/MPA barrel, 6mm CM, 80 rounds of factory ammo fired prior to today.
Barrel cleaned of carbon, 5 rounds factory ammo fired today prior to testing, charges fired round robin, reverse round robin and round robin (3 rounds per charge), with 10 min cooling between sequences. Rounds were single fed, about 20-30 sec between. Test distance was 200 yards. Lapua once fired, neck turned brass, Federal 205M primers, RL 16, Berger 105 hybrid bullets. Seated 45 thou off the lands, not going to be able to go any closer, the bearing surface is only half seated, so I could go deeper. The factory loads are seated to include the entire bearing surface. Felt good about all the shots.
Attached is a photo of the target, the brass and the data graphs. The brass photos are increasing charge weights from left to right. In addition to the average height above the aim point baseline, I have graphed the total of each loads total distance above or below the baseline... its basically the same data, but accentuates the changes for visual clarity. So you can look at the muzzle velocity data and ocw type info as well as group sizes, horizontal and vertical spreads. Hey your observations are welcome. The loads were weighed with the autothrow/autotrickler system. Thank you gentlemen!


Last edited:

