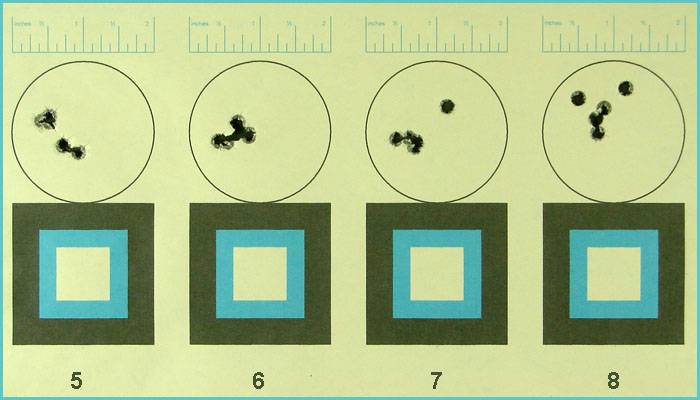
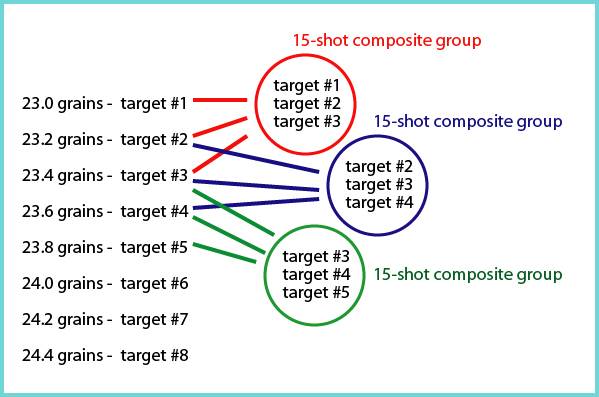
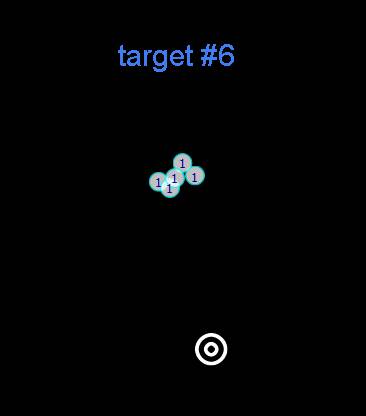
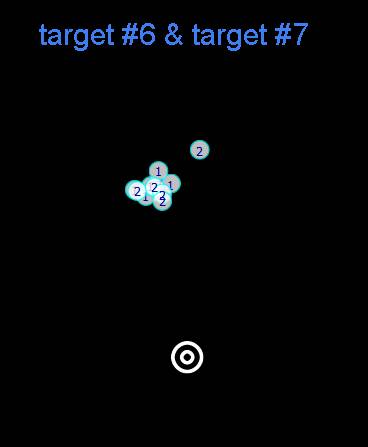
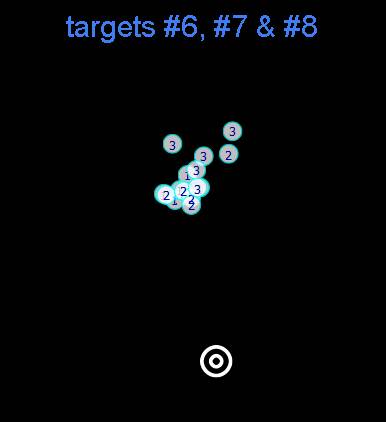
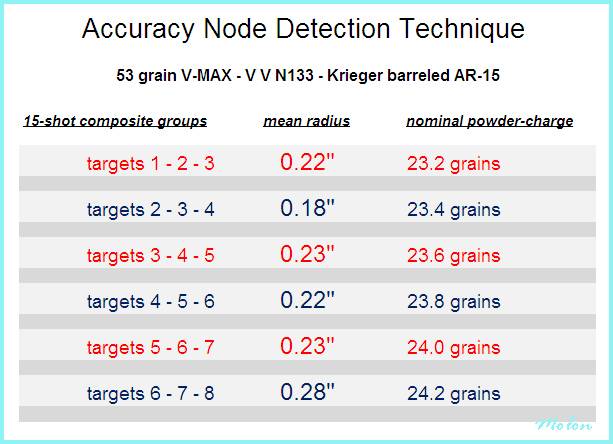
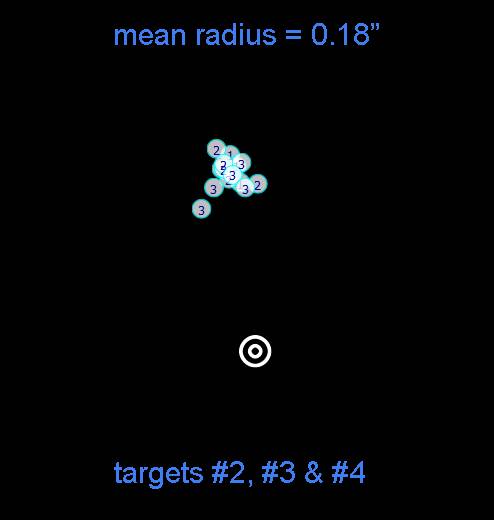
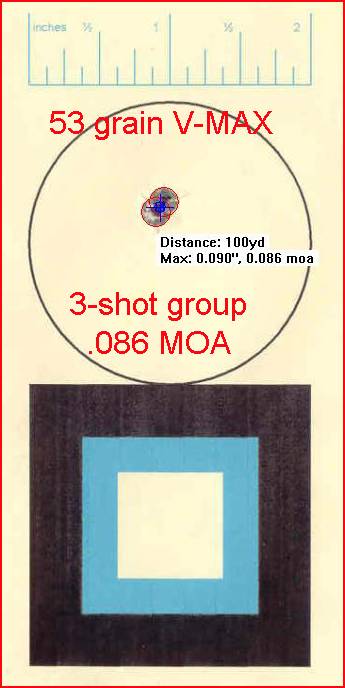
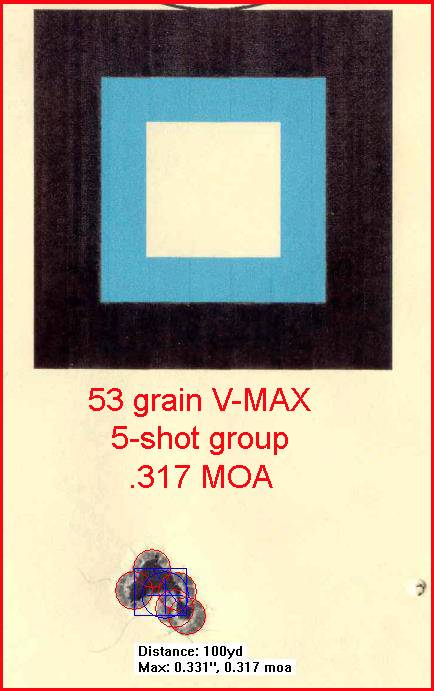
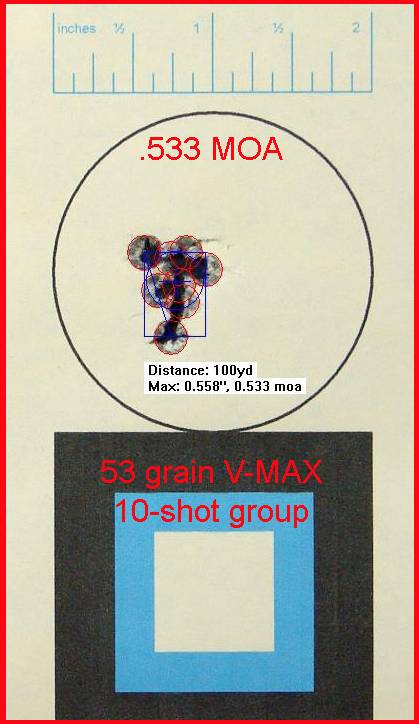
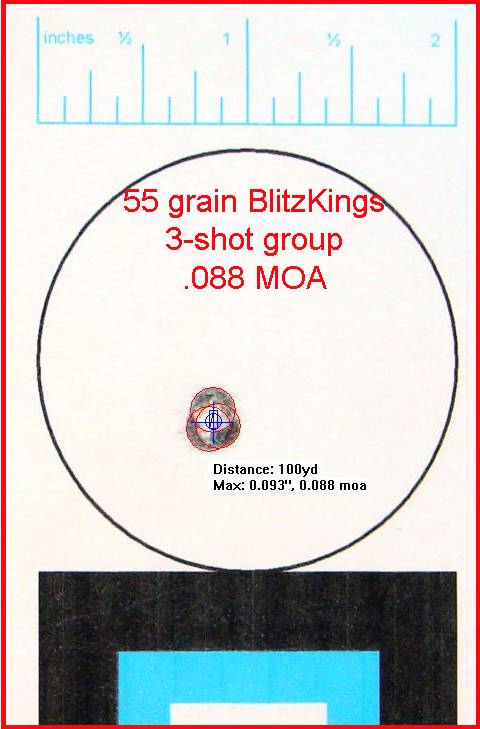
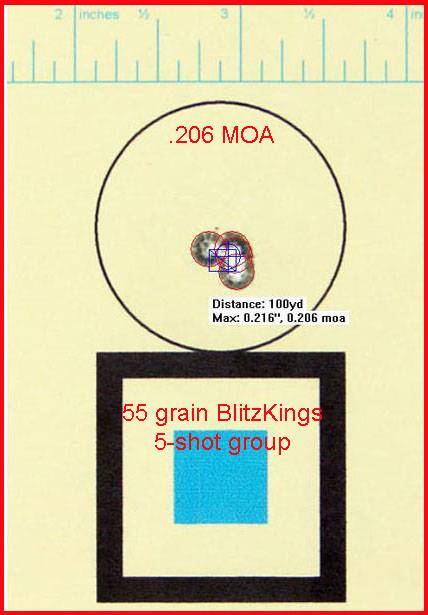
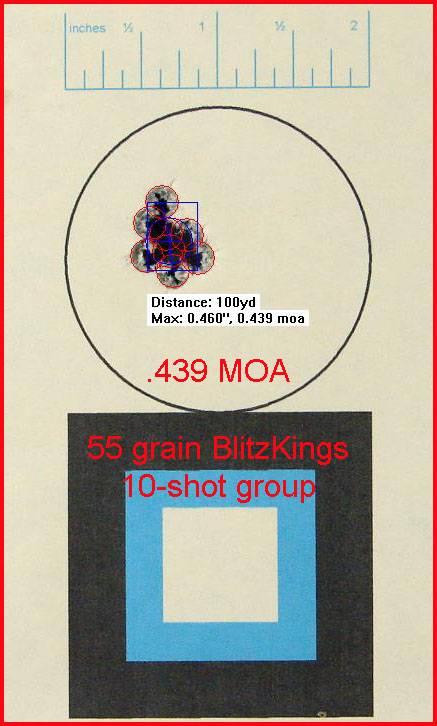
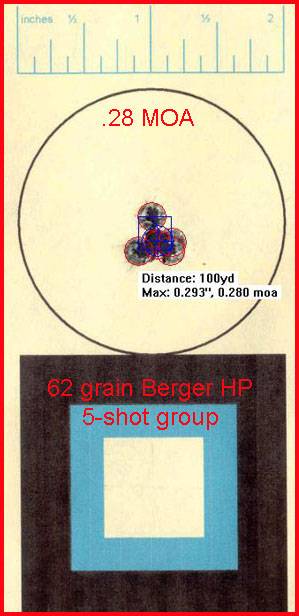
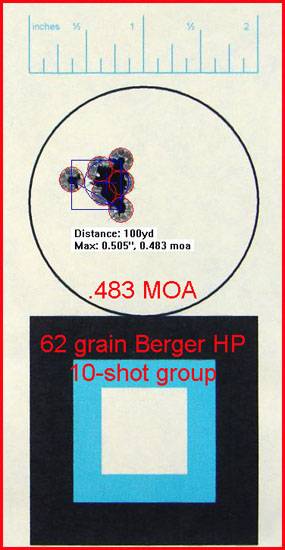
I’ve had numerous requests for this over the years, so here‘s an introduction to one of the techniques that I use for developing a hand-load for the AR-15.
Reloading For The AR-15: Molon's Accuracy Node Detection Technique
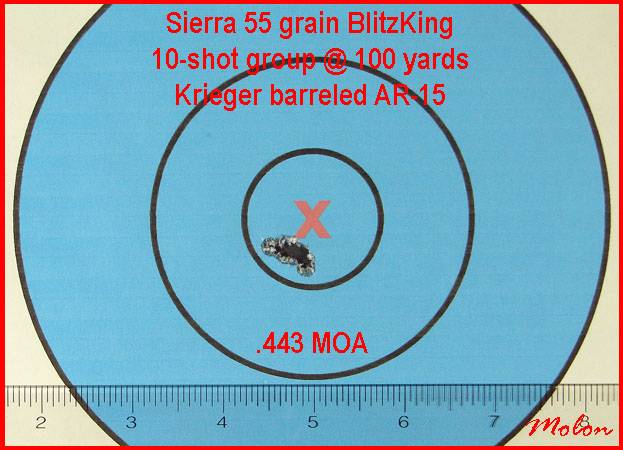
The Accuracy Node Detection Technique (ANDT) is simply a tool to aid hand-loaders in determining the specific powder-charge that is most likely to deliver the highest level of accuracy (technically precision) from their AR-15 with a particular powder and bullet.
Those of you familiar with Creighton Audette’s Incremental Load Development Method (Ladder Test) or Dan Newberry’s Optimal Charge Weight method may recognize that the Accuracy Node Detection Technique is based on the same underlying principle as those methods, however, the ANDT is a more refined and statistically meaningful approach to finding an accuracy node.
The ANDT uses larger effective sample sizes for greater confidence and utilizes the mean radius to determine the radial dispersion of composite shot-groups to obtain a more exact identification of the accuracy node of a given barrel/bullet/powder combination. For those of you not familiar with the mean radius, I’ll be explaining that shortly.
The ANDT is not dependent upon “interpreting” the data like other methods; the data is what it is and the results speak for themselves. However, keep in mind that 60% of a load’s accuracy comes from the bullet. If you’re not using a quality bullet that your barrel “likes,” no amount of powder-charge testing is going to result in a load that produces sub-MOA 10-shot groups from you AR-15.
A chronograph is not needed for the ANDT. If you’re only interested in long-range shooting, this is not the article you‘re looking for. I developed the ANDT for working-up short range (200 yards and in) match-grade hand-loads that consistently produce sub-MOA 10-shot groups from my match-grade AR-15s.
As I mentioned above, the ANDT utilizes the mean radius to accurately and precisely determine the radial dispersion of the composite shot-groups that we will develop using the ANDT. The demonstration below shows how to manually calculate the mean radius, but modern ballistic programs make this task far easier.
A PRIMER ON THE MEAN RADIUS
The mean radius is a method of measurement of the radial dispersion of shot-groups that takes into account every shot in the group. It provides a more useful analysis of the consistency of ammunition and firearms than the commonly used method of extreme spread.
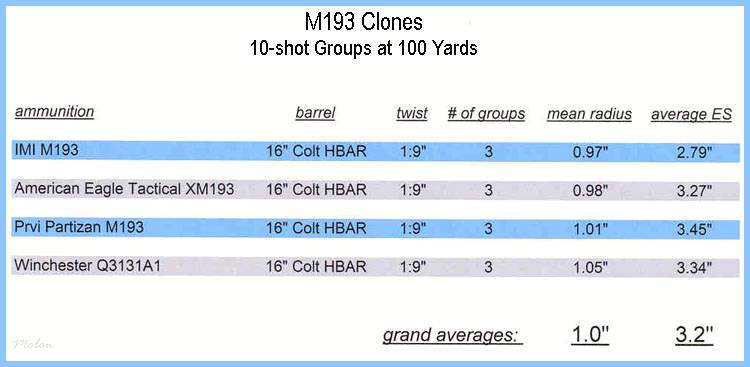
Mean radius as defined in Hatcher's Notebook “is the average distance of all the shots from the center of the group. It is usually about one third the group diameter (extreme spread)” for 10-shot groups. (The ratio is actually closer to 3.2 times the mean radius = the extreme spread, for 10-shot groups, depending on the sample size and the morphology of the particular groups sampled.)
To obtain the mean radius of a shot-group, measure the heights of all shots above the lowest shot in the group. Average these measurements. The result is the height of the center of the group above the lowest shot. Then in the same way, get the horizontal distance of the center from the shot farthest to the left. These two measurements will locate the group center. Now measure the distance of each shot from this center. The average of these measures is the mean radius.
Once you get the hang of measuring groups using the mean radius it becomes very simple to do. While being very simple to do, it is also very time consuming. Modern software programs such as RSI Shooting Lab and On Target make determining the mean radius a snap.
The picture below is a screen capture from RSI Shooting Lab. The red cross is the center of the group (a little high and right of the aiming point). The long red line shows the two shots forming the extreme spread or group size. The yellow line from the red cross to one of the shots is a radius. Measure all the radii and take the average to obtain the mean radius.
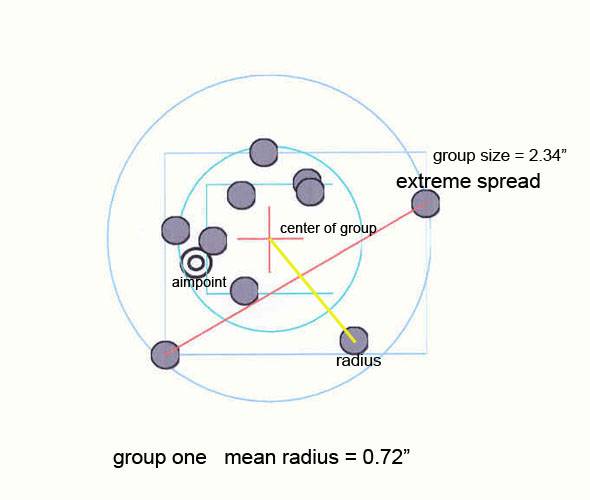
Mean Radius Demonstration
Let’s say you fired a 5-shot group from 100 yards and the resulting target looks like this. (The X-ring measures 1.5” and the 10-ring measures 3.5”.)
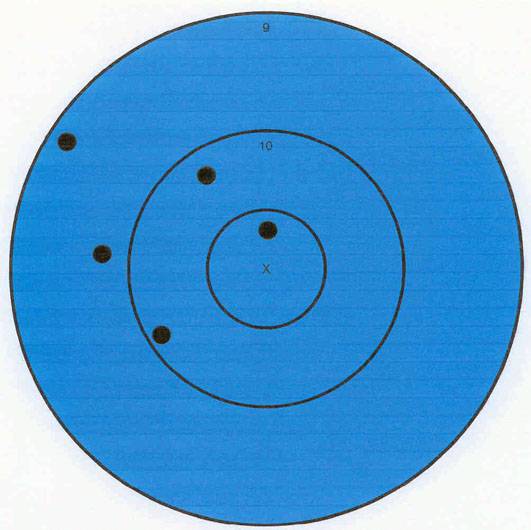
The extreme spread of the group measures 2.83”, but we want to find the mean radius (or average group radius.) In order to find the mean radius we must first find the center of the group. By “eye-balling” the target most people would see that the group is centered to the left of the “X-ring” and probably a little high, but we need to find the exact location of the center of the group.
Locating the Center of the Group
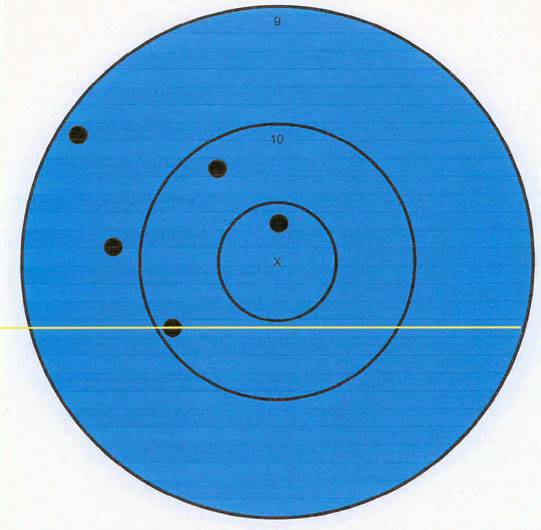
The first step in finding the center of the group is to find the lowest shot of the group and draw a horizontal line through the center of that shot.
Next, find the left-most shot of the group and draw a vertical line through the center of that shot.
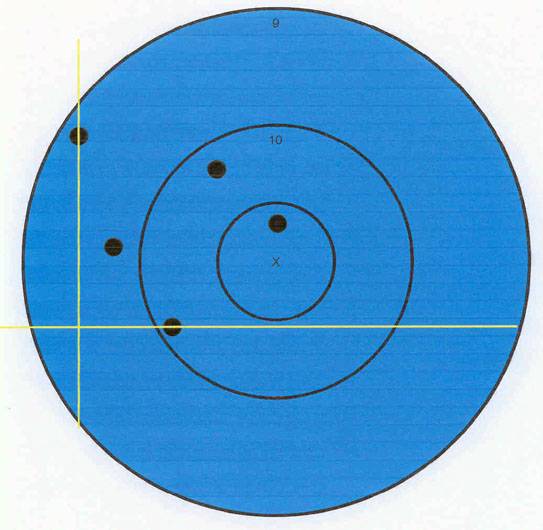
Now measure the distance from the horizontal line to the other four shots of the group that are above that line. Add those numbers together and divide by the total number of shots in the group (5).
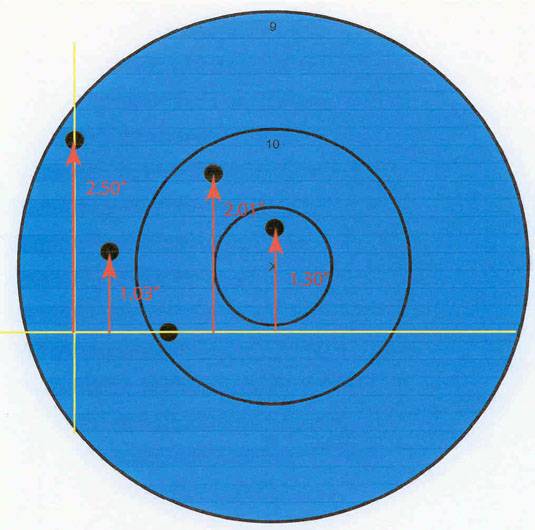
2.50” + 1.03” + 2.01” + 1.30” = 6.84”
Divide by 5 to get 1.37”. This number is the elevation component of the center of the group.
Next we need to find the windage component of the center of the group. From the vertical line, measure the distance to the other four shots of the group that are to the right of the line. Add those numbers together and again divide by the total number of shots in the group (5).
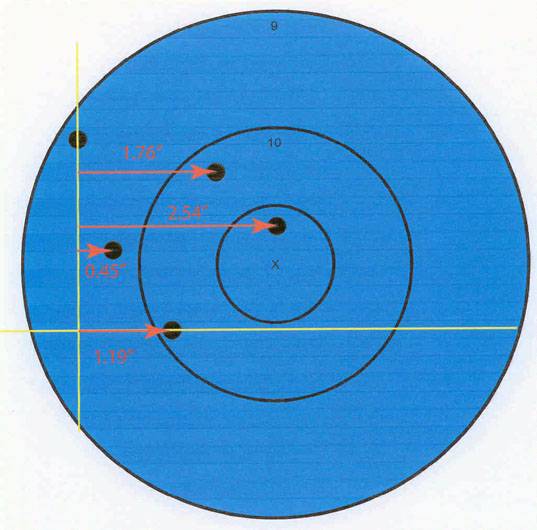
1.76” + 2.54” + 0.45” + 1.19” = 5.94”
Divide by 5 to get 1.19” This is the windage component of the center of the group.
Finding the windage and elevation components of the center of the group is the most difficult part of this process. Once that is done the rest of the process is a piece of cake.
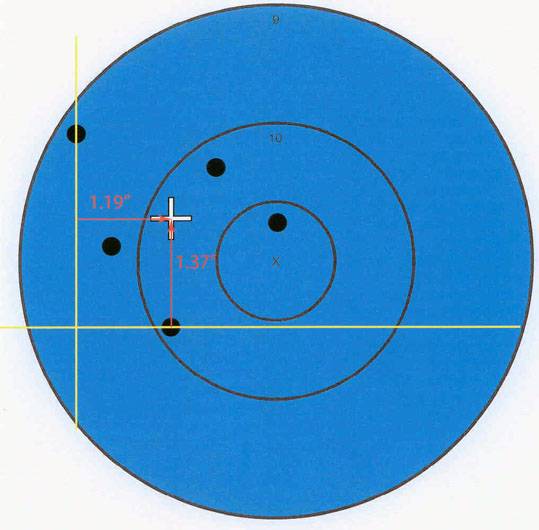
Using the windage and elevation components, locate the position on the target that is 1.37” (elevation component) above the horizontal line and 1.19” (windage component) to the right of the vertical line. This location is the center of the group!
Determining the Mean Radius
Now that we have located the position of the center of the group, the first step in determining the mean radius is to measure the distance from the center of the group to the center of one of the shots. This line is a single “radius”.
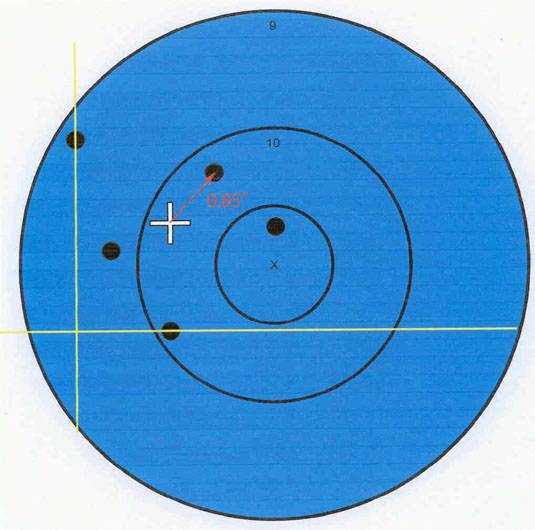
Now measure the distance from the center of the group to the center of each of the rest of the shots in the group. Add the measurements of all the radii together and then divide by the total number of shots in the group (5).
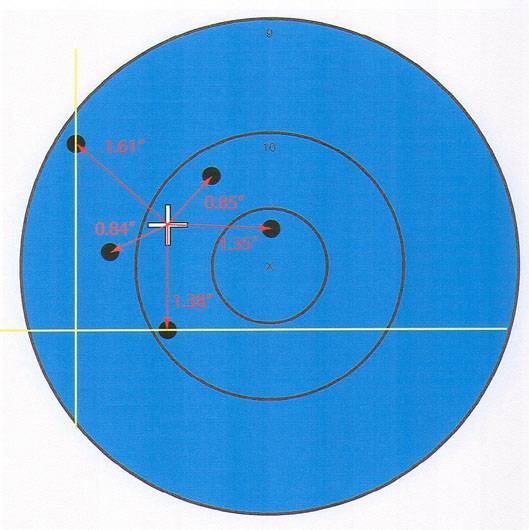
0.85” + 1.35” + 1.38” + 0.84” + 1.61” = 6.03”
Divide by 5 to get 1.21”. This is the mean radius (or average group radius) of the group!
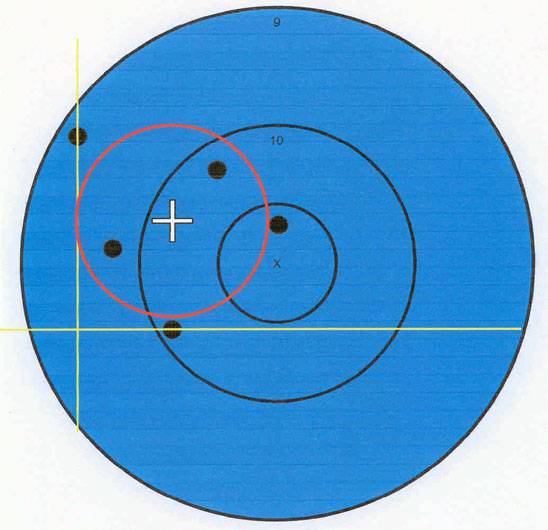
Using the mean radius measurement to scribe a circle around the center of the group gives you a graphic representation of the mean radius. This shows the average accuracy of all the shots in the group. This demonstrates why the mean radius is much more useful than the extreme spread in evaluating the radial dispersion of our rifles and ammunition.
The table below will give you an idea of the relationship between the mean radius and extreme spread for 10-shot groups.
Here are some interesting quotes from old issues of American Rifleman on the subject:
“Mean radius is the mean distance of bullet impacts from center of the test group. It is used in government ammunition acceptance because it takes account of every shot and comes close to maximizing the test information. While there is no exact relationship between this measure and the simpler and more convenient group diameter, the 10-shot group diameter averages slightly over 3 times the mean radius.”
"These examples illustrate the sensitiveness of the extreme spread to number of shots in the group. Indeed, as the table indicates, the measures made to only the outside shots of the group, e.g. the extreme spread, are very sensitive to number of shots, while the measures made to all the shots, e.g. the mean radius are far less so. It may be added that the latter measures are also less variable in their representation of the group; they are more efficient. This explains why the target testing of U.S. military rifle ammunition is by mean radius."
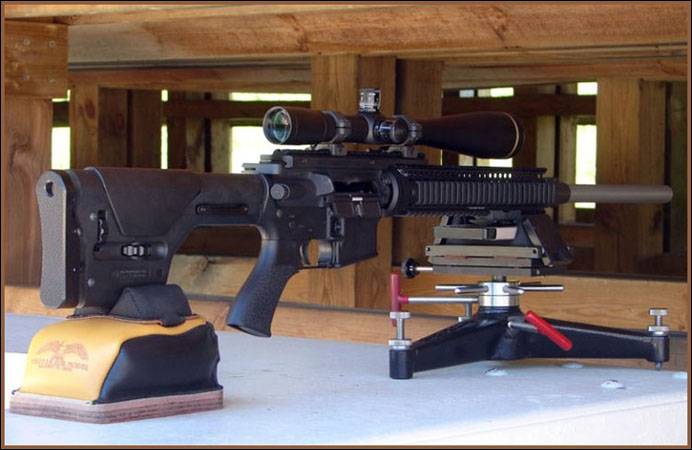
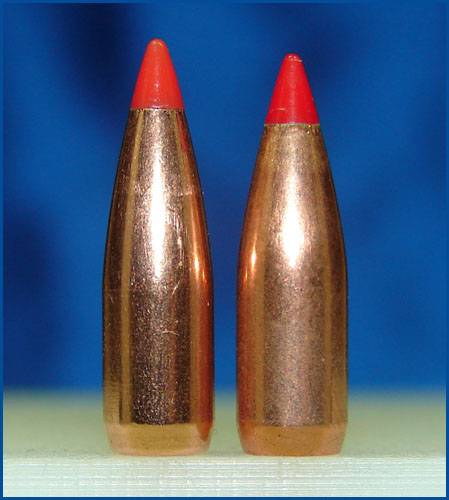
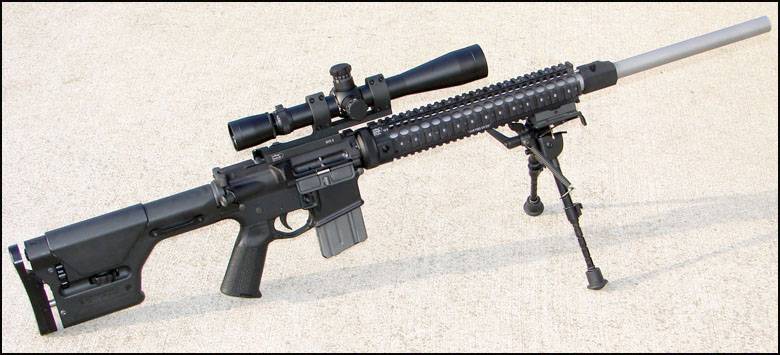
Now that you understand the mean radius, we can delve into some particulars of the Accuracy Node Detection Technique. For the example that I’ll be presenting in this article, I was looking for an accuracy node for the Hornady 53 grain V-MAX (#22265) when charged with VihtaVuori N133 powder and fired from my 223 Remington 24” Krieger barreled AR-15. But first, a word from our sponsor:
WARNING!
Reloading is an inherently dangerous activity. The information provided here is for educational purposes only. It is not intended to be used for the actual loading of ammunition by the reader. No warranty, guarantee or assurance that these loads are safe is stated, suggested or implied nor should any be inferred. Usage of this information for the actual loading of ammunition may result in malfunctions, damage and destruction of property and grave injury or death to beings human in nature or otherwise. Don't even view this information in the presence of children or small animals.
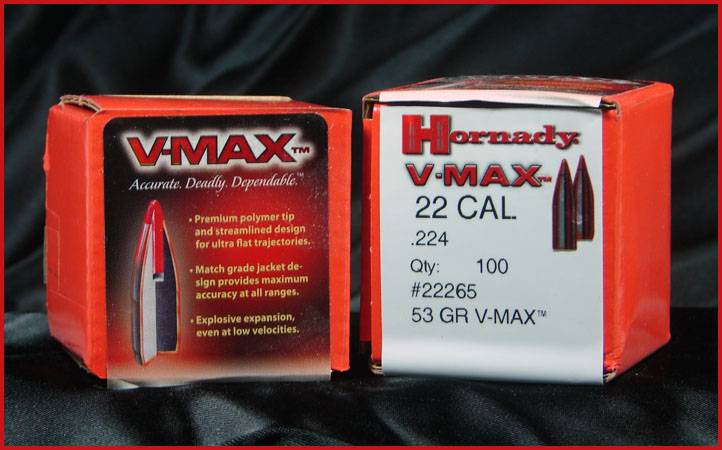
53 V-MAX on the left . . .
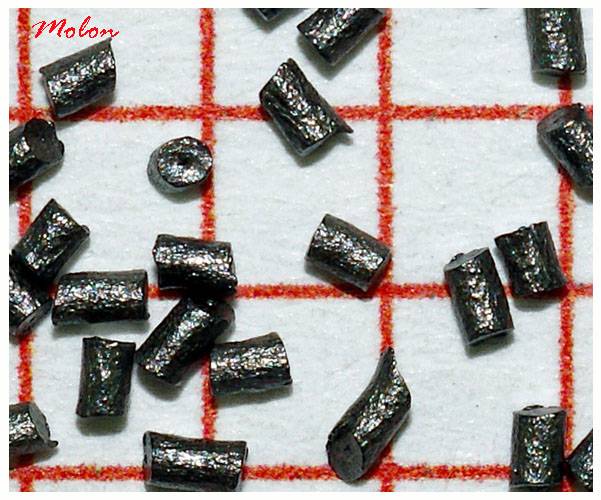
VihtaVuori N133 (the individual red squares in the grid below are 1/10 of an inch.)
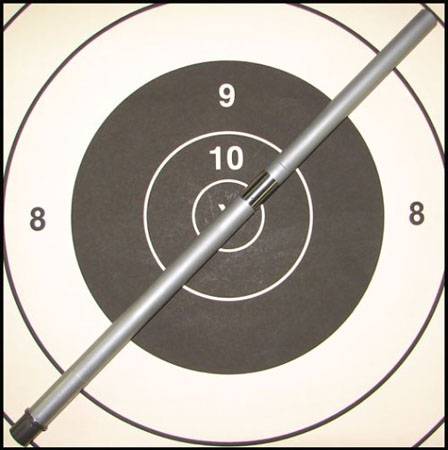
24” Krieger barrel . . .
continued in the next post . . .
Reloading For The AR-15: Molon's Accuracy Node Detection Technique

The Accuracy Node Detection Technique (ANDT) is simply a tool to aid hand-loaders in determining the specific powder-charge that is most likely to deliver the highest level of accuracy (technically precision) from their AR-15 with a particular powder and bullet.
Those of you familiar with Creighton Audette’s Incremental Load Development Method (Ladder Test) or Dan Newberry’s Optimal Charge Weight method may recognize that the Accuracy Node Detection Technique is based on the same underlying principle as those methods, however, the ANDT is a more refined and statistically meaningful approach to finding an accuracy node.
The ANDT uses larger effective sample sizes for greater confidence and utilizes the mean radius to determine the radial dispersion of composite shot-groups to obtain a more exact identification of the accuracy node of a given barrel/bullet/powder combination. For those of you not familiar with the mean radius, I’ll be explaining that shortly.
The ANDT is not dependent upon “interpreting” the data like other methods; the data is what it is and the results speak for themselves. However, keep in mind that 60% of a load’s accuracy comes from the bullet. If you’re not using a quality bullet that your barrel “likes,” no amount of powder-charge testing is going to result in a load that produces sub-MOA 10-shot groups from you AR-15.
A chronograph is not needed for the ANDT. If you’re only interested in long-range shooting, this is not the article you‘re looking for. I developed the ANDT for working-up short range (200 yards and in) match-grade hand-loads that consistently produce sub-MOA 10-shot groups from my match-grade AR-15s.
As I mentioned above, the ANDT utilizes the mean radius to accurately and precisely determine the radial dispersion of the composite shot-groups that we will develop using the ANDT. The demonstration below shows how to manually calculate the mean radius, but modern ballistic programs make this task far easier.
A PRIMER ON THE MEAN RADIUS
The mean radius is a method of measurement of the radial dispersion of shot-groups that takes into account every shot in the group. It provides a more useful analysis of the consistency of ammunition and firearms than the commonly used method of extreme spread.
Mean radius as defined in Hatcher's Notebook “is the average distance of all the shots from the center of the group. It is usually about one third the group diameter (extreme spread)” for 10-shot groups. (The ratio is actually closer to 3.2 times the mean radius = the extreme spread, for 10-shot groups, depending on the sample size and the morphology of the particular groups sampled.)
To obtain the mean radius of a shot-group, measure the heights of all shots above the lowest shot in the group. Average these measurements. The result is the height of the center of the group above the lowest shot. Then in the same way, get the horizontal distance of the center from the shot farthest to the left. These two measurements will locate the group center. Now measure the distance of each shot from this center. The average of these measures is the mean radius.
Once you get the hang of measuring groups using the mean radius it becomes very simple to do. While being very simple to do, it is also very time consuming. Modern software programs such as RSI Shooting Lab and On Target make determining the mean radius a snap.
The picture below is a screen capture from RSI Shooting Lab. The red cross is the center of the group (a little high and right of the aiming point). The long red line shows the two shots forming the extreme spread or group size. The yellow line from the red cross to one of the shots is a radius. Measure all the radii and take the average to obtain the mean radius.

Mean Radius Demonstration
Let’s say you fired a 5-shot group from 100 yards and the resulting target looks like this. (The X-ring measures 1.5” and the 10-ring measures 3.5”.)

The extreme spread of the group measures 2.83”, but we want to find the mean radius (or average group radius.) In order to find the mean radius we must first find the center of the group. By “eye-balling” the target most people would see that the group is centered to the left of the “X-ring” and probably a little high, but we need to find the exact location of the center of the group.
Locating the Center of the Group
The first step in finding the center of the group is to find the lowest shot of the group and draw a horizontal line through the center of that shot.

Next, find the left-most shot of the group and draw a vertical line through the center of that shot.

Now measure the distance from the horizontal line to the other four shots of the group that are above that line. Add those numbers together and divide by the total number of shots in the group (5).

2.50” + 1.03” + 2.01” + 1.30” = 6.84”
Divide by 5 to get 1.37”. This number is the elevation component of the center of the group.
Next we need to find the windage component of the center of the group. From the vertical line, measure the distance to the other four shots of the group that are to the right of the line. Add those numbers together and again divide by the total number of shots in the group (5).

1.76” + 2.54” + 0.45” + 1.19” = 5.94”
Divide by 5 to get 1.19” This is the windage component of the center of the group.
Finding the windage and elevation components of the center of the group is the most difficult part of this process. Once that is done the rest of the process is a piece of cake.
Using the windage and elevation components, locate the position on the target that is 1.37” (elevation component) above the horizontal line and 1.19” (windage component) to the right of the vertical line. This location is the center of the group!

Determining the Mean Radius
Now that we have located the position of the center of the group, the first step in determining the mean radius is to measure the distance from the center of the group to the center of one of the shots. This line is a single “radius”.

Now measure the distance from the center of the group to the center of each of the rest of the shots in the group. Add the measurements of all the radii together and then divide by the total number of shots in the group (5).

0.85” + 1.35” + 1.38” + 0.84” + 1.61” = 6.03”
Divide by 5 to get 1.21”. This is the mean radius (or average group radius) of the group!
Using the mean radius measurement to scribe a circle around the center of the group gives you a graphic representation of the mean radius. This shows the average accuracy of all the shots in the group. This demonstrates why the mean radius is much more useful than the extreme spread in evaluating the radial dispersion of our rifles and ammunition.

The table below will give you an idea of the relationship between the mean radius and extreme spread for 10-shot groups.

Here are some interesting quotes from old issues of American Rifleman on the subject:
“Mean radius is the mean distance of bullet impacts from center of the test group. It is used in government ammunition acceptance because it takes account of every shot and comes close to maximizing the test information. While there is no exact relationship between this measure and the simpler and more convenient group diameter, the 10-shot group diameter averages slightly over 3 times the mean radius.”
"These examples illustrate the sensitiveness of the extreme spread to number of shots in the group. Indeed, as the table indicates, the measures made to only the outside shots of the group, e.g. the extreme spread, are very sensitive to number of shots, while the measures made to all the shots, e.g. the mean radius are far less so. It may be added that the latter measures are also less variable in their representation of the group; they are more efficient. This explains why the target testing of U.S. military rifle ammunition is by mean radius."
Now that you understand the mean radius, we can delve into some particulars of the Accuracy Node Detection Technique. For the example that I’ll be presenting in this article, I was looking for an accuracy node for the Hornady 53 grain V-MAX (#22265) when charged with VihtaVuori N133 powder and fired from my 223 Remington 24” Krieger barreled AR-15. But first, a word from our sponsor:
WARNING!
Reloading is an inherently dangerous activity. The information provided here is for educational purposes only. It is not intended to be used for the actual loading of ammunition by the reader. No warranty, guarantee or assurance that these loads are safe is stated, suggested or implied nor should any be inferred. Usage of this information for the actual loading of ammunition may result in malfunctions, damage and destruction of property and grave injury or death to beings human in nature or otherwise. Don't even view this information in the presence of children or small animals.

53 V-MAX on the left . . .

VihtaVuori N133 (the individual red squares in the grid below are 1/10 of an inch.)

24” Krieger barrel . . .


continued in the next post . . .

