How do you have a paper chart for Density Altitude (DA) changes in your dope? Do any of you have a DA sheet in your Data Book?
I have read and been told to have drop charts for every 2000DA change. My home range is usually around 2000DA. This means I need a drop chart for -2000ft, 0ft, 2000ft, 4000ft, 6000ft, 8000ft, 10,000ft. That's 7 pages in a dope book for
one rifle. I don't really want to have that many pages for
one rifle (yes, I want ONE data Book for all my rifles). With 3 rifles is 21 pages to sift through. So... below is the chart I made for changing DA. Now I have 2 pages, my Home range dope chart with the wind information on the back and a DA dope chart.
Things to Note
- Data recorded - at the top of the chart is how I got the DA numbers. This way I can reference how temperature might change the DA as well as the station pressure. (note the comment in the margin about how temp change = DA change)
- All of these are at 50% humidity. To keep this simple I had to eliminate a variable, humidity was it. While I think it will effect things more after 1000yds I don't think it has enough variance inside 1000 to worry about.
- Wind - The wind row has 2 numbers in it. The 2 numbers are the wind speeds that are equivalent to the wind hold for 2000DA. Example - if I'm shooting at 6000DA, 800 yards - a 7mph hold is 0.9 mils (6mph from 2000DA) and a 12mph hold is 1.6mil (10mph hold for 2000DA) this allowed the chart to re-use 2 columns of information for each DA change and for me to know what my Rifle MPH is at each DA.
- After doing this I think the chart will work out to 1000 or 1100 yards. After that a more refined DA chart may be warranted. At 1100 yards jumping 2000DA is a 0.4 mil jump, that's about 16" of change. For an accurate shot I recommend consulting your Ballistic program on the longer shots with changing DA, but these values will at least give you a starting point if you don't have any other information. of you'll need to pin down your true DA and guess between numbers if needed.
- I presented this chart in 2 ways. 1st - straight data. 2nd is the plus or minus from the home range value. Doing the 2nd version can help us understand how much DA can really effect our dope. The 2nd if more for informational used and not necessarily something I would have in my data book.
Let me know what you think.
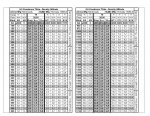
1st chart Raw DA values
View attachment 7172626
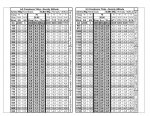
2nd chart - Difference in DA from my home range.
View attachment 7172627


